Debugging
Logging Output
The Logging output is the main source of information when the ETL application behaves unexpectedly, both during development, and when deployed to test and production servers.
- If there is an issue with the logging itself, check the
NLog internal log file, and if needed also
enable its
Infoor more verbose log events. Also consider temporarily removing any "nlog.config" file, to instead get the actionETL default logging configuration. - If the application crashes or hangs, and log events seems to be missing at the end, consider switching from asynchronous and buffered logging, to synchronous and unbuffered logging, while troubleshooting.
- If the
Infolevel information is insufficient, consider switching toDebuglevel, which is normally OK also in production.- The
Tracelevel is even more verbose, but is normally not OK to enable globally in production. When using it, consider only enabling it for the specific worker or port that needs more verbose logging.
- The
- If the issue is directly related to your code (e.g. your custom worker, or callbacks you've added to the out of box workers), consider logging additional messages from your code.
- Also consider ways to improve logging by changing the implementation, e.g.:
- Add or change workers, e.g. to take action when an earlier worker fails
- Increase logging from dataflow, e.g. by adding additional columns to rows, as well as using error output ports (which can dump row contents).
Using the Debugger
When using the logging output is not sufficient for resolving the issue, running a debugger on the application is often a good choice. This is most commonly done as part of development, but you can also attach the debugger to an already running process, both locally and remotely (e.g. even in production).
When stopped in the debugger, you can traverse the worker system hierarchy and dataflow ports using the following properties:
- WorkerParent.Children (a property on workers and the worker system)
- WorkerBase.Parent
- WorkerBase.Outputs and any typed output properties,
often called
Output - WorkerBase.Inputs and any typed input properties,
often called
Input - OutputPortBase.Worker
- InputPort.Worker
While troubleshooting, consider using KeepChildrenLevels to retain more than the top-most level of workers.
Note
A Debug build is the preferred and easiest to debug, since optimizations are turned off, and it by default includes your source code.
You can also debug a Release build, although optimizations can make it trickier, with many temporary variables removed from your code etc. Dataflow Port Breakpoints work well even with Release builds. For some scenarios, consider temporarily suppressing JIT optimization.
Breakpoints in Your Code
You can step through your code in a debugger, and also add and run to breakpoints (F9
and F5 respectively in Visual Studio) in your code. This is particularly useful for
checking the application:
- Before creating the worker system
- Before starting the worker system
- During worker creation
- During execution of callbacks you have added, including dataflow callbacks
- After the worker system has completed, to check the properties of completed workers
- Sending dataflow rows to a
CollectionTarget, breaking in the debugger after the worker system has finished and checkingCollectionTarget.Rowsis simple and useful. More advanced scenarios are covered below.
- Sending dataflow rows to a
Here's an example with multiple breakpoints added:

Note
To view the dataflow rows when your dataflow doesn't include a suitable worker to put
a breakpoint in, either temporarily add a RowActionTransaform1 to the dataflow as per
above, or use Dataflow Port Breakpoints
instead.
WorkerParent State Breakpoints
You can't set a normal breakpoint for when a worker runs or completes, since this is handled inside the actionETL code.
Instead use the WorkerParent.DebugCommands property to instruct actionETL to launch or break a debugger when a worker or the worker system changes status. You can view current worker and worker hierarchy, and where supported even edit their properties. This can be very useful to check the exact configuration of a worker before it runs, and after it completes.
If the next example is run with debugging, the debugger will hit a breakpoint for:
- All state changes of the "check trigger" worker (i.e.
Created,Running, and any completed state) - The
Runningstate of the "target" worker
// using actionETL;

private sealed class MyRow
{
    public string Description;
    public int Metric;
}
var workerSystem = new WorkerSystem()
    .Root(ws =>
    {
        var exists = new FileExistsWorker(ws, "check trigger", "myfile.trg", false);
        exists.DebugCommands = DebugWorkerParentCommands.BreakOnAll;

        var source = new RepeatRowsSource<MyRow>(ws, "source", () => exists.IsSucceeded,
            2000, new MyRow { Description = "The answer is", Metric = 42 }
            );

        var target = source.Output.Link.CollectionTarget("target");
        target.DebugCommands = DebugWorkerParentCommands.BreakOnRunning;
    });
workerSystem.Start().ThrowOnFailure();
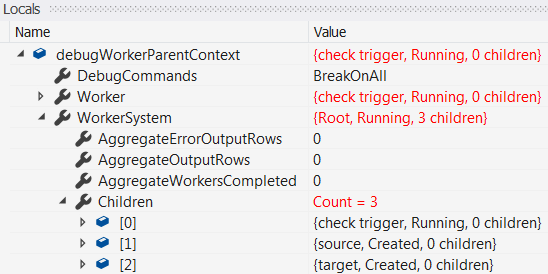
When stopped in the debugger from these breakpoints, use the Locals window and expand debugWorkerParentContext
to show exactly which worker, and worker system hit the breakpoint. You can also view
worker properties, the worker hierarchy etc. Where supported, you can even edit properties.
Here we have stopped on "check trigger" getting the Running state. We have also expanded the
WorkerSystem instance, and can e.g. navigate its Children worker hierarchy.
Important
- The "Break" command only works when the debugger is already attached to the application. Switch to a "Launch" command to have the application launch and attach the debugger (if needed) when hitting a breakpoint. This allows debugging even when just running the EXE from the command line.
- If the debugger is not launching with "Launch*" as expected, ensure it is the default debugger
for managed code. In Visual Studio e.g., enable Tools > Options > Debugging > Just In Time >
Managed.
- If the Just In Time section is not present in the options, use "Visual Studio Installer" > Modify > Individual Components > Debugging and testing > Just-In-Time debugger to install it.
Dataflow Port Breakpoints
You can instruct actionETL to launch or break a debugger when one or more dataflow ports change status, or when output and error output ports send dataflow rows. You can view and even edit rows before they are passed to the downstream worker. This can be very useful to discover where in the dataflow an issue originates.
Important
- Enabling port debugging brings a noticeable performance overhead; a warning is logged for each port where it is enabled.
- Rows sent to unlinked error output ports cannot be viewed in the debugger.
Port debugging is controlled by the following members:
| Member | Description |
|---|---|
| OutputPortBase.DebugCommands | Launch/break on state changes and/or rows sent. |
| OutputPortBase.DebugBreakAfterRows | Launch/break after any, or a specific number of rows sent, and ports completed. |
| OutputPortBase |
Methods setting the above properties. |
This example generates 2000 rows, and does a simple transformation on them. It enables port debugging on both the source and transform output ports, breaking the debugger when either worker sends rows, as well as when each output port (and its downstream input port) completes.
The "Break" command only works when the debugger is already attached to the application. Use a "Launch" command to have the application launch and attach the debugger (if needed) when hitting a breakpoint. This allows debugging even when just running the EXE from the command line.
// using actionETL;

private sealed class MyRow
{
    public string Description;
    public int Metric;
}
var workerSystem = new WorkerSystem()
    .Root(ws =>
    {
        new RepeatRowsSource<MyRow>(ws, "source", 2000
            , new MyRow { Description = "The answer is", Metric = 42 }
            )
        .Output
        .SetDebugCommands(DebugPortCommands.BreakOnRowsAndStateCompleted)

        .Link.RowActionTransform1("transform", row => { row.Metric *= 2; } )
        .Output
        .SetDebugCommands(DebugPortCommands.BreakOnRowsAndStateCompleted)

        .Link.CollectionTarget("target");
    });
workerSystem.Start().ThrowOnFailure();
When stopped in the debugger, use the Locals window to view (and optionally edit) rows to be sent
downstream. The port Locator and status is displayed in the top row:

Expand debugPortContext to show exactly which output port (and it's downstream input), worker, and
worker system hit the breakpoint, and you can also view their properties. Here we have expanded the
WorkerSystem instance, and can navigate its Children worker hierarchy.
Furthermore, we have also set DebugBreakAfterRows to 1000; when we Continue, this port won't break until it gets to the 1000's row (i.e. #999). You can also modify DebugCommands to change or disable port debugging.
